Ayala Land, Inc.
ALI technically completed the Bearish Gartley harmonic pattern and fully tested the PRZ (Potential Reversal Zone ) around 39.56~40.95.
See previous analysis of this harmonic pattern for reference:
https://psetrends.blogspot.com/2017/05/ali-price-action-update.html
Trading Plan
- As noted in the previous analysis, completing the harmonic pattern is a potential profit taking opportunity. Scale down position or take some profit and profit run the rest of the position using trailing-stop.
Showing posts with label ALI. Show all posts
Showing posts with label ALI. Show all posts
Wednesday, May 31, 2017
Tuesday, May 9, 2017
ALI price action update
Ayala Land, Inc.
ALI is potentially forming a Bearish Gartley harmonic pattern with a PRZ (Potential Reversal Zone) around 39.56 (39.56~40.95 range). The recent breakout from its immediate resistance area around the B leg gives it a higher probability of completing the harmonic pattern.
Trading Plan
- Avoid for now if you are not it a trade yet.
- The PRZ area is a potential profit taking zone.
Sunday, April 2, 2017
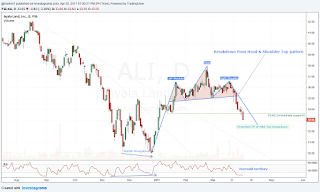
ALI H&S Top breakdown update
Ayala Land, Inc.
ALI's price action after a Head-and-Shoulder Top breakdown is now getting closer to its projected breakdown price target around 32.20~32.60. It also recently broke the immediate support at 33.60.
*At extreme oversold territory.
Trading Plan
- Observe the price action for now as it gets closer to the breakdown target.
- Buy the reversal pattern near or around the breakdown target area (ideally with a confirmation before entry).
- A potential position trade opportunity if the price drops near or below 31.
Wednesday, February 10, 2016
ALI: Toppish Pattern
Ayala Land, Inc.
ALI is now potentially forming a toppish pattern with a bearish Evening Star candlestick pattern. Pullback/consolidation may likely follow.
*Immediate resistance at 33.
*Immediate support at 30 or around 38.2%~50% retracement area (29.8~30.4).
Trading Plan
- For medium to long term position, accumulate near 30 or below.
- For short term position, buy on pullback using the Fibonacci retracement levels as reference. Observe any reversal patterns around the 38.2% ~ 61.8% retracement. Avoid if downtrend momentum continues without any sign of bottoming out pattern.
Wednesday, August 5, 2015
ALI: Inverse H&S + Bearish Shark pattern
Ayala Land Inc.
Potentially forming an Inverse Head-and-Shoulder pattern (bullish). A breakout from this pattern will have a measured target of around 42.
Also potentially forming a Bearish Shark harmonic pattern with potential reversal zone between 40~42.
Immediate support at 36.75.
Immediate resistance at 38.9
Trading Plan
- Test buy near the immediate support area with stop-loss just below 35.7 and a TP of 40~42 (risk/reward ratio of at least 1:3).
- Also a potential buy on breakout from Inverse Head-and-Shoulder pattern with an initial TP of 42.
 |
| Inverse Head-and-Shoulder pattern |
 |
| Bearish Shark harmonic pattern |
Subscribe to:
Posts (Atom)


