Megaworld Corporation
MEG is currently consolidating in a Symmetrical Triangle pattern, a potential trend continuation pattern from the recent reversal after it bottomed out at 3.21. A breakout from this pattern will have a projected target around 4.35 ~ 4.40. On the other hand, a breakdown from this pattern will potentially put the price back towards 3.50 ~ 3.21 area.
*If the consolidation continues near the apex of the triangle, it will likely invalidate the whole Triangle pattern.
*Immediate support around 3.50 ~ 3.60.
*Immediate resistance around 3.89 ~ 4.00.
Trading Plan
- Buy on breakout.
Monday, February 20, 2017
Monday, February 13, 2017
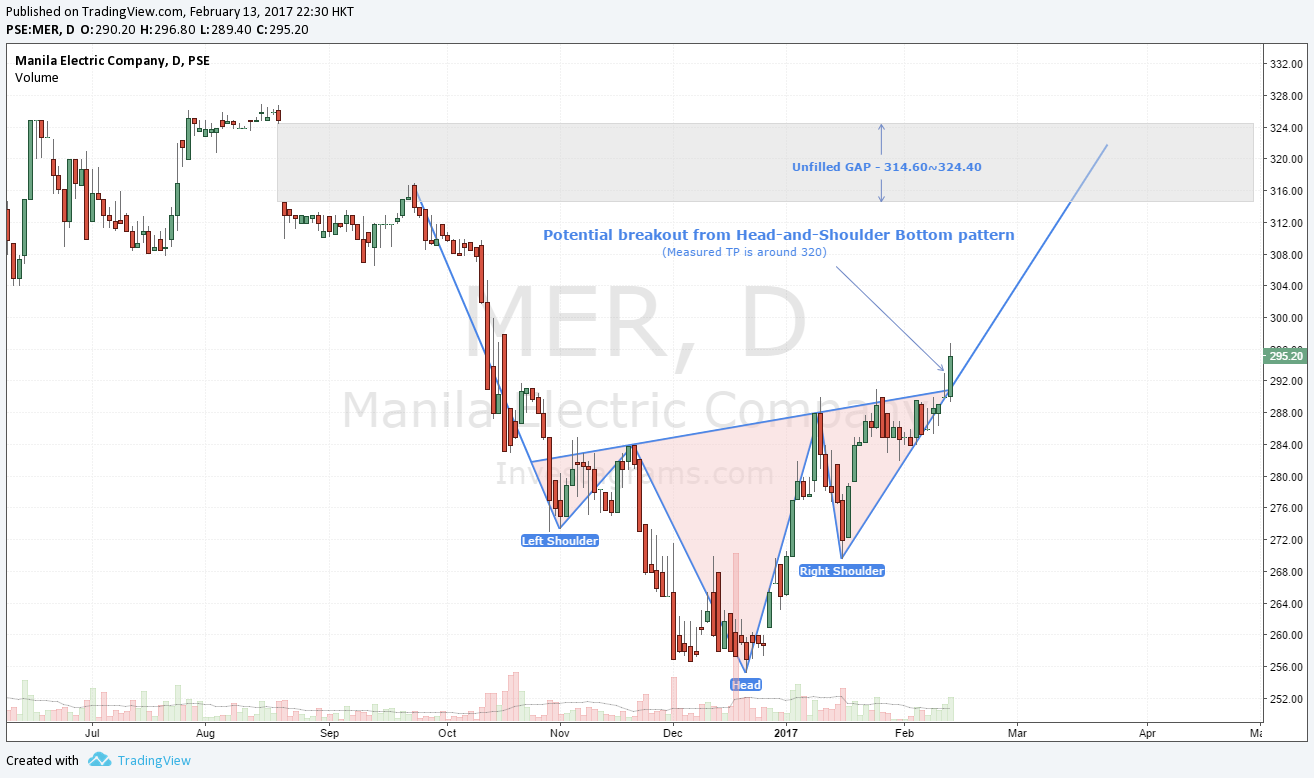
MER potential breakout from Head-and-Shoulder Bottom pattern
Manila Electric Company
MER is on a potential breakout from a Head-and-Shoulder Bottom pattern (bullish pattern). Measured target is around 320.
*A successful breakout will also potentially fill the gap at 314.60 ~ 324.40 range.
*Immediate resistance is around 300, the previous major support prior to breakdown.
Trading Plan
- Buy the breakout (but expect for potential fallback).
- TP=320
- Set a stop-loss to at least 1:2 risk/reward ratio but ideally around 1:3.
MER is on a potential breakout from a Head-and-Shoulder Bottom pattern (bullish pattern). Measured target is around 320.
*A successful breakout will also potentially fill the gap at 314.60 ~ 324.40 range.
*Immediate resistance is around 300, the previous major support prior to breakdown.
Trading Plan
- Buy the breakout (but expect for potential fallback).
- TP=320
- Set a stop-loss to at least 1:2 risk/reward ratio but ideally around 1:3.
Wednesday, February 8, 2017
MRSGI potentially forming a bullish trend continuation pattern
Metro Retail Stores Group, Inc.
MRSGI is potentially forming a Falling Wedge pattern, a bullish trend continuation pattern. A breakout from this pattern will likely revisit the resistance around 4.4~4.5.
*Potential bullish signal on Stochastic near the oversold territory.
*Support around 3.52/3.5.
Trading Plan
- Buy on breakout.
- Potential target to initally take profit or scale down position is around the resistance area.
- Set stop-loss on breakdown from support at 3.5 (risk/reward ratio is not very attractive when immediate TP is only around 4.4~4.5. Profit run on breakout from resistance.
MRSGI is potentially forming a Falling Wedge pattern, a bullish trend continuation pattern. A breakout from this pattern will likely revisit the resistance around 4.4~4.5.
*Potential bullish signal on Stochastic near the oversold territory.
*Support around 3.52/3.5.
Trading Plan
- Buy on breakout.
- Potential target to initally take profit or scale down position is around the resistance area.
- Set stop-loss on breakdown from support at 3.5 (risk/reward ratio is not very attractive when immediate TP is only around 4.4~4.5. Profit run on breakout from resistance.
Tuesday, February 7, 2017
GTCAP potentially near the bottom
GT Capital Holdings, Inc.
Recent breakdown from a Double-Top pattern has already hit its measured TP at 1210.
Another breakdown from Ascending Broadening Wedge pattern presents more downside risk towards the major support at 1084~1123 area.
*Stochastic indicator at oversold territory, a signal crossover from this level will likely confirm the reversal.
*RSI is also near oversold territory (using immediate trend bias, its already considered oversold and now showing sign of recovery)
*Immediate resistance at 1298.
Trading Plan
- Trading buy near the recent Double-Top breakdown target at 1210.
- Set stop-loss around 1084~1175 area depending on risk appetite. For position trade, set stop-loss on breakdown from this support range.
- Immediate TP near 1298/1300. Can take initial profit at this level and profit run the rest on breakout from 1300 resistance.
Recent breakdown from a Double-Top pattern has already hit its measured TP at 1210.
Another breakdown from Ascending Broadening Wedge pattern presents more downside risk towards the major support at 1084~1123 area.
*Stochastic indicator at oversold territory, a signal crossover from this level will likely confirm the reversal.
*RSI is also near oversold territory (using immediate trend bias, its already considered oversold and now showing sign of recovery)
*Immediate resistance at 1298.
Trading Plan
- Trading buy near the recent Double-Top breakdown target at 1210.
- Set stop-loss around 1084~1175 area depending on risk appetite. For position trade, set stop-loss on breakdown from this support range.
- Immediate TP near 1298/1300. Can take initial profit at this level and profit run the rest on breakout from 1300 resistance.
Tuesday, January 31, 2017
Ichimoku Cloud Trading Strategy
Even though the name implies one cloud, the Ichimoku Cloud is really a set of indicators designed as a stand alone trading system. These indicators can be used to identify support and resistance, determine trend direction and generate trading signals. Ichimoku Kinko Hyo, which is the full name, translates into “one look equilibrium chart”. With one look, chartists can identify the trend and look for potential signals within that trend.
Tenkan-sen (Conversion Line):
(9-period high + 9-period low)/2)) </b> On a daily chart, this line is the mid point of the 9-day high-low range, which is almost two weeks.
Kijun-sen (Base Line):
(26-period high + 26-period low)/2)) </b> On a daily chart, this line is the mid point of the 26-day high-low range, which is almost one month.
Senkou Span A (Leading Span A):
(Conversion Line + Base Line)/2)) </b> This is the midpoint between the Conversion Line and the Base Line. The Leading Span A forms one of the two Cloud boundaries. It is referred to as “Leading” because it is plotted 26 periods in the future and forms the faster Cloud boundary.
Senkou Span B (Leading Span B):
(52-period high + 52-period low)/2)) </b> On the daily chart, this line is the mid point of the 52-day high-low range, which is a little less than 3 months. The default calculation setting is 52 periods, but can be adjusted. This value is plotted 26 periods in the future and forms the slower Cloud boundary.
View Strategy Details Here
⇨ https://stockcharts.com/school/doku.php?id=chart_school:trading_strategies:ichimoku_cloud
Tenkan-sen (Conversion Line):
(9-period high + 9-period low)/2)) </b> On a daily chart, this line is the mid point of the 9-day high-low range, which is almost two weeks.
Kijun-sen (Base Line):
(26-period high + 26-period low)/2)) </b> On a daily chart, this line is the mid point of the 26-day high-low range, which is almost one month.
Senkou Span A (Leading Span A):
(Conversion Line + Base Line)/2)) </b> This is the midpoint between the Conversion Line and the Base Line. The Leading Span A forms one of the two Cloud boundaries. It is referred to as “Leading” because it is plotted 26 periods in the future and forms the faster Cloud boundary.
Senkou Span B (Leading Span B):
(52-period high + 52-period low)/2)) </b> On the daily chart, this line is the mid point of the 52-day high-low range, which is a little less than 3 months. The default calculation setting is 52 periods, but can be adjusted. This value is plotted 26 periods in the future and forms the slower Cloud boundary.
View Strategy Details Here
⇨ https://stockcharts.com/school/doku.php?id=chart_school:trading_strategies:ichimoku_cloud
Subscribe to:
Posts (Atom)