Monday, February 29, 2016

BLOOM: At make or break point

Bloomberry Resorts Corporation

BLOOM failed to break so far its 9-month downtrend resistance line and recently on a breakdown from a Rising Wedge pattern, a bearish trend continuation pattern with measured target around 2.40~2.80 area.

Trading Plan
- Avoid for now unless there's a breakout from its downtrend price channel that is supported by huge volume.
- Potential reentry in case there's no breakout would be to wait on another correction or pullback near the downtrend support line.


Tuesday, February 23, 2016

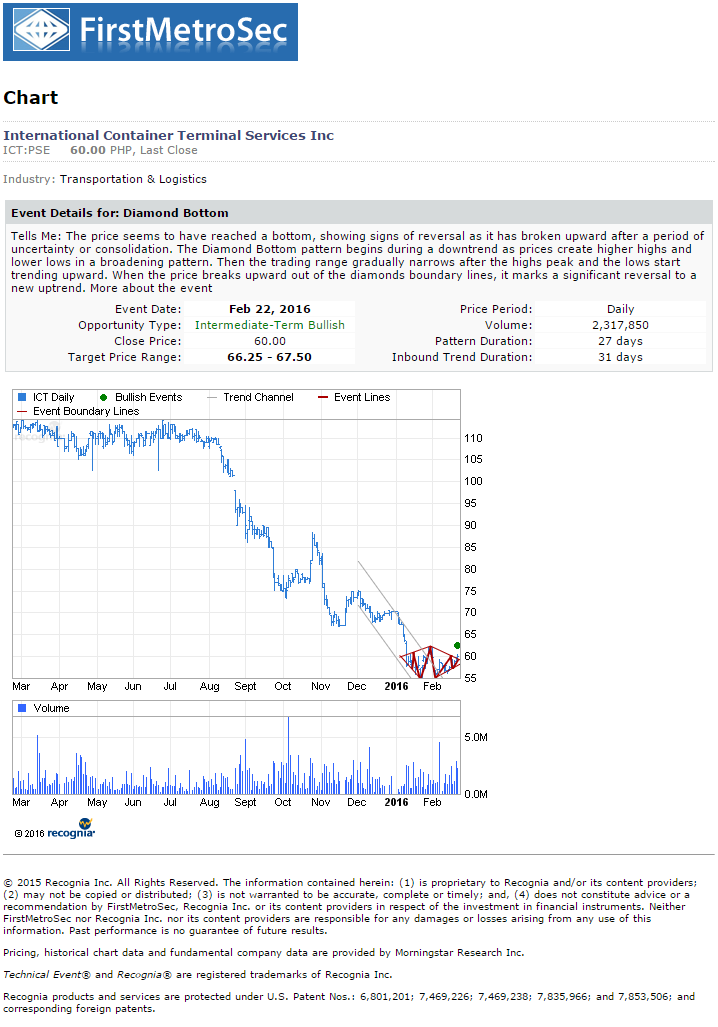
ICT: Diamond Bottom

International Container Terminal Services, Inc.

Diamond Bottom
The price seems to have reached a bottom, showing signs of reversal as it has broken upward after a period of uncertainty or consolidation. The Diamond Bottom pattern begins during a downtrend as prices create higher highs and lower lows in a broadening pattern. Then the trading range gradually narrows after the highs peak and the lows start trending upward. When the price breaks upward out of the diamonds boundary lines, it marks a significant reversal to a new uptrend.

Event Date: Feb 22, 2016
Opportunity Type: Intermediate-Term Bullish
Close Price: 60.00
Target Price Range: 66.25 ~ 67.50

Price Period: Daily
Volume: 2,317,850
Pattern Duration: 27 days
Inbound Trend Duration: 31 days

Analysis and Chart Source
Firstmetrosec Recognia technical event scan tool
http://fmsec.com.ph/


Monday, February 22, 2016

PSPC: Potential breakout play

Phoenix Semiconductor Philippines Corp.

PSPC on a potential breakout:
  • Breakout from an Invested Head-and-Shoulder pattern with measured target around 2.
  • Breakout from its 15-month downtrend line with measured target around 2.2~2.3.

*Immediate resistance at 1.94.
*It recently completed the Bearish AB=CD harmonic pattern (a potential signal to take some profit on short term position)

Trading Plan
- If trading the Inverted Head and Shoulder pattern breakout, buy near the breakout area with stop-loss near the recent swing low and TP at 2. Trade with caution as the risk/reward ratio on this setup is quite low.
- If trading the downtrend line breakout, buy near the breakout area and TP at 2.2~2.3 range. Set stop-loss near the recent low for a risk/reward ratio of at least 1:2.
- If holding a position from the recent dip near 1.30, the completion of a Bearish AB=CD harmonic pattern is a potential sign of a pullback or retracement to follow. Take some profit on short term position and profit run the rest.


FGEN: Potentially ripe for short term profit taking

First Gen Corporation

FGEN recently hit the measured target from Double-Bottom pattern breakout around 20.74 (note that the Double-Bottom pattern formed up with a Bullish Divergence pattern on RSI which makes a strong case of a high probability trade entry).

FGEN is now approaching the resistance zone around 21~22 which is around 50% retracement from the recent peak (or 38.2% retracement from October 2015 peak). The 21.1 resistance is also the previous support prior to breakdown. These convergence of resistance levels is a potential short term profit taking area for short term positions.

Bullish Scenario:
- The breakout from 4-months downtrend line supported by above average volume is also a potential breakout play. Measured target is near 25.

Trading Plan
- If trading the Double-Bottom breakout, take some profit like 50% of the position and profit run the rest with trailing-stop.
- The resistance zone shown in the chart is also a potential short term target to take profit. Scale-down short term position and profit run the rest.
- If trading the breakout from 4-month downtrend line, buy near the breakout area with stop-loss around the double-bottom breakout resistance level (around 19). Set TP near 25 for a risk/reward ratio of at least 1:2.


Sunday, February 21, 2016

MCP: Chart Update

Melco Crown Philippines

MCP recently found a roadblock at the convergence of multiple resistance levels.

The Head-and-Shoulder Bottom pattern (Inverted H&S) remains valid for now. The neckline is also the immediate resistance area around 2.34. Immediate support at 1.86.
  • A breakout from this H&S pattern will have a measured target around 3.5.
  • Breakdown from support with price action moving towards the H&S head area will likely invalidate the Inverted H&S pattern.

Recent rally is still considered a DCB (Dead Cat Bounce) from the longer term downtrend line if it fails to break that trend.

If major support at 1.15 holds up from a sharp correction, potential Double-Bottom pattern will likely develop. A breakdown from 1.15  will confirm the DCB and price action will likely move towards new lows.

Note
This is just an update from the previous post "MCP: Potential DCB":
http://psetrends.blogspot.com/2016/02/mcp.html

Trading Plan
- Avoid for now.
- Buy only the breakout from Inverted H&S if it also breaks the longer downtrend line supported by above average volume.